
Written in October 2026
What are spiky profiles?
Well, in my head it’s the silhouette of a hedgehog! In fact, that’s not too far from the reality. A spiky profile is what many neurodivergent people have when it comes to our areas of strength and areas of challenge.
When we plot these things on a radar chart, we end up with a spiky profile, with big jumps from the things we find easy, to the things we find difficult.
What do they look like?
I’ve made a couple of radar charts showing spiky profiles, the first is this autism-specific one from myautisticprofile.com. This came pre-loaded with these areas which apply to everyone, but which are commonly different in autistic people.
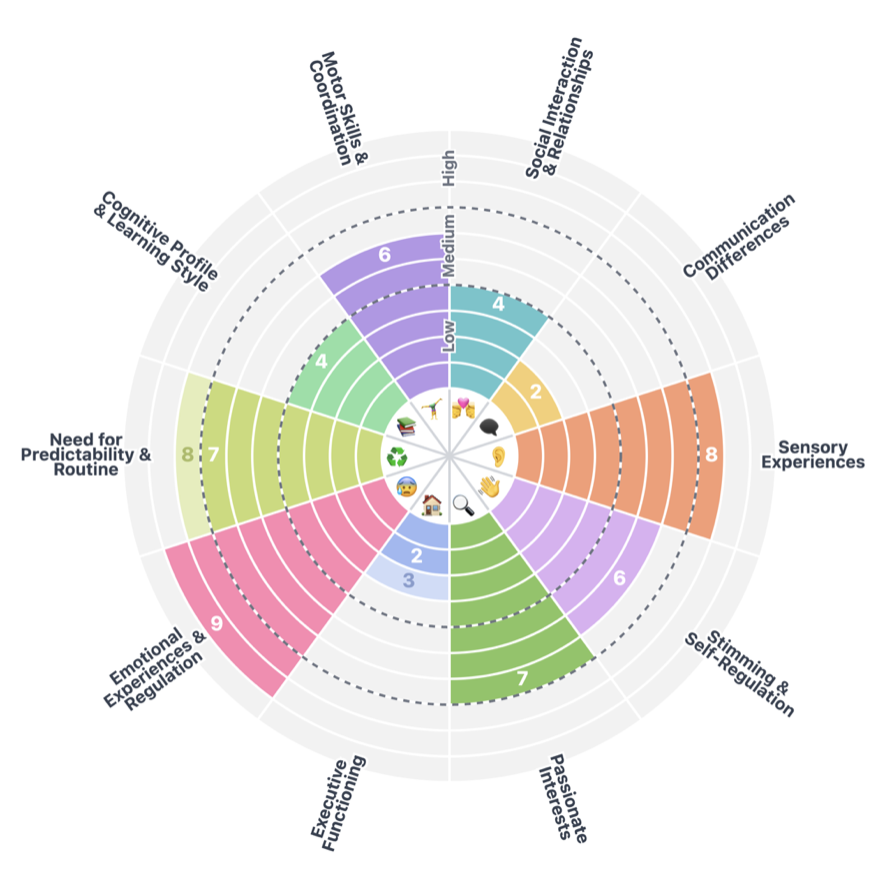
When we plot an autistic person’s profile we end up with a spiky one, where an allistic person will have a much smoother profile, being generally good (or poor) at all types of communication or regulation.
I also made a workplace specific one with a tool intended for geographers! It is in fact just a blank widget for making radar graphs, so you can set your own titles for each axis, and your own scale. I used 0-10 for my scale, rating my abilities in each area of workplace functioning which were then plotted on the radar chart. I didn’t rate myself as a 10 in any area, however, so the chart looks like the scale is 0-9.
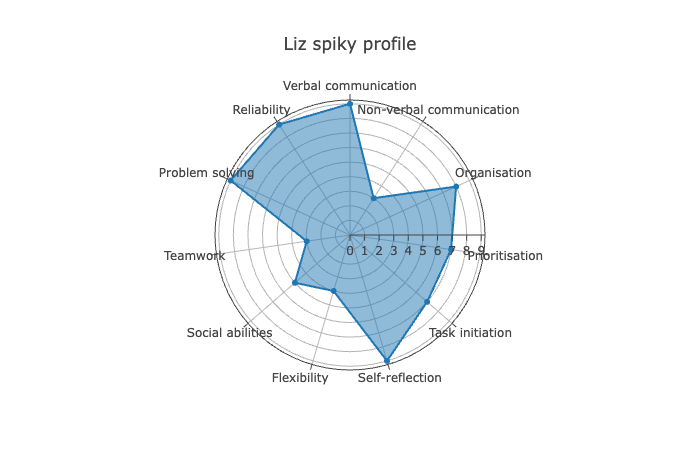
Radar graphs generally show the areas of weakness, or areas of lower score, in the centre, and areas of higher capability (higher score) towards the outside of the graph.
Why are they useful?
Firstly, radar graphs, or spiky profile charts, are very visual and can be interpreted easily by a range of people without anyone needing experience of data analysis or interpretation.
Secondly they are useful for understanding ourselves and others in different contexts. You can make a profile for different environments (sensory, expectational environments etc.) and see in which contexts you need more, or less support.
They’re also useful for plotting progress over time; as we age we continue to develop skills, and then as we get into midlife we may experience regression in some of these skills (due to natural ageing, hormonal changes and life changes).
They can be used to show the differences between self-assessment of different skills vs. the perception of others in an easily comparable way
How can I make one?
If you want the autism specific one, go to www.myautisticprofile.com and dive straight in, or if you want to play around with different criteria, head to this creator tool and play around. You can even use this one to rate different recipes, TV shows, fandoms, or whatever piques your interest.